|
Page 1, 2
Twenty years and more ago, when many of the practitioners reading this article were in medical school, we were taught that a fasting blood glucose measurement was an adequate screen for blood sugar issues. As long as it was below 100, it was considered normal and therefore of no consequence. Even those who practiced more proactively often considered fasting glucose a reliable indicator of glucose regulation, although perhaps levels above 90 would raise red flags. Glucose levels higher than 100 might trigger further evaluation with an oral glucose tolerance test (OGTT). Hemoglobin A1c (glycosylated hemoglobin) was then considered only for use in patients already diagnosed as diabetic. The focus was entirely on blood glucose. Insulin was rarely measured.
The limitation of relying entirely on these measurements is that, in the insulin-resistant individual, rising insulin levels may well keep blood sugar at normal, even optimal, levels for years, while elevated circulating insulin damages blood vessels and contributes to central weight gain. By the time the overworked pancreatic cells begin to decrease production of insulin and blood glucose levels skyrocket, the damage has been done. The road back to optimal blood sugar control is much more difficult at this point. Typically, patients go on blood–sugar lowering pharmaceuticals and remain on them the rest of their lives, even if they make changes in their dietary and exercise habits.
Today, of course, the phenomenon of insulin resistance is widely recognized, but the tests commonly used for screening may be missing a great number of patients who could benefit earlier detection and intervention. Let's look at the available tests.
Fasting Glucose
Fasting glucose, as noted above, doesn't really test for insulin resistance, but is important because it is commonly included in a comprehensive metabolic panel or other health screening panel and therefore may be the first sign that there is a problem. Optimal for fasting glucose is probably in the mid-80s, but this level should not be interpreted as a sign that insulin resistance is absent.
Oral Glucose Tolerance Test (OGTT)
The classic OGTT was done over a period of 2 to 3 hours with draws done at fasting, and 30, 60, 90, and 120 minutes after a 75 to 100 gram glucose challenge. Sometimes a 3-hour (180 minute) draw was also done. Over time, the number of draws was reduced and the glucose challenge was standardized. The current recommendation of the World Health Organization is a 75gm glucose challenge for adults.1 A standard OGTT now consists of a baseline (fasting) draw and a 2-hour post-challenge draw (Table 1).2
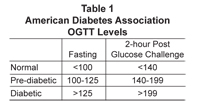 The shortcoming of the standard OGTT is that it is entirely possible to have fasting and 2-hour glucose levels in the normal range and still have elevated insulin values, a sign that insulin sensitivity is diminishing and that ever-increasing levels of insulin are required to maintain glucose regulation. The shortcoming of the standard OGTT is that it is entirely possible to have fasting and 2-hour glucose levels in the normal range and still have elevated insulin values, a sign that insulin sensitivity is diminishing and that ever-increasing levels of insulin are required to maintain glucose regulation.
Hemoglobin A1c/Fructosamine
Hemoglobin A1c (also known as glycosylated or glycated hemoglobin) measures the degree to which hemoglobin molecules in red blood cells have been glycated or have had sugar molecules attached to them. Because red blood cells have a life span of around 120 days, this measurement allows us to assess average blood sugar levels over the past 3 to 4 months. Once used only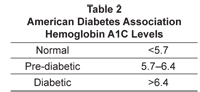 for monitoring blood sugar in diabetics, HgbA1c is now routinely used by integrative and mainstream practitioners as a screening and monitoring tool (Table 2). The optimal level for HgbA1c used by many functional medicine practitioners is ≤5.4% for monitoring blood sugar in diabetics, HgbA1c is now routinely used by integrative and mainstream practitioners as a screening and monitoring tool (Table 2). The optimal level for HgbA1c used by many functional medicine practitioners is ≤5.4%
Fructosamine measures glycated serum proteins, particularly albumin, which suggests average blood sugar over the previous 2 to 3 weeks. It has much more limited utility, and values between labs can vary due to differences in methodology. Patient age, gender, and other factors can also affect fructosamine values. It is most useful for monitoring efficacy of treatment that might be expected to show results rather quickly. It is also used in place of HcbA1c in individuals with disorders that affect red blood cells, such as sickle cell disease and hemolytic anemia.
Fasting Insulin
Fasting insulin measurements started being used about 15 years ago by practitioners looking for a way of assessing insulin resistance. Normal values for fasting insulin are anywhere from <30 to <20, depending on the laboratory. However, optimal fasting insulin is considerably lower, usually considered to be ≤10. Many practitioners consider optimal to be closer to ≤6. Using fasting insulin to assess insulin resistance can be misleading, as it is quite possible to have a fasting insulin of <10 and still have insulin resistance. This can be seen clearly in the graphs of patient results later in this article.
In short, we have very well-established methods for assessing glucose regulation, allowing us to easily diagnose patients as nondiabetic, prediabetic, or diabetic. What has been missing is a reliable way to detect insulin resistance in those years when insulin levels are rising but still keeping blood sugar levels down. This need is answered by the glucose tolerance/insulin response test.
Glucose Tolerance/Insulin Response (GTIR)
The glucose tolerance/insulin response test is based on a classic OGTT, with measurements made at baseline (fasting) and at multiple points after a glucose challenge. At each point, both glucose and insulin are measured. The results are graphed and the insulin response is classified according to patterns. These patterns describe a progression of insulin response from completely normal to the flat curve seen with islet cell exhaustion. Patterns early in the progression can detect insulin resistance even when fasting and 2-hour glucose and fasting insulin are at optimal levels. This allows for much earlier intervention, which can halt the progression of insulin resistance.
The GTIR test is based on the research of Dr. Joseph Kraft, a clinical pathologist, who has been studying insulin response and diabetes since the 1970s. Kraft (MD, MS, FCAP) was chairman of the Department of Pathology and Nuclear Medicine at St. Joseph Hospital in Chicago from 1972 to 1998. His paper, "Detection of Diabetes Mellitus In Situ (Occult Diabetes)," was originally published in Laboratory Medicine in 1975.3 This study included 3650 patients who had been referred for a glucose tolerance test to rule out (or in) diabetes mellitus. Patients had a fasting blood draw and then received a 100 gram glucose challenge, followed by blood draws at 30 minutes, and at hours 1 through 4 after consumption of the glucose drink.
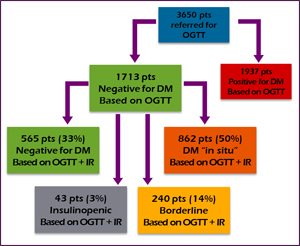
Based on the glucose tolerance test alone, 1937 patients (53%) were diagnosed as having DM; 1713 patients (47%) were determined to be normal (Figure 1). But Dr. Kraft had tested insulin for these patients at the same time, and analysis of the insulin values revealed a different story for the "normal" group. Of the normal group, 565 patients (33%) were still deemed normal after analyzing insulin response. 862 patients (50%) were determined to have what Dr. Kraft characterized as "diabetes in situ," a term that he adopted "because it embodies the concept of disease detection at its earliest identifiable point." Another 240 patients (14% of the "normal" group) were found to be borderline. 43 patients (~3%) had a flat insulin curve suggestive of islet cells that were no longer producing adequate insulin (Figure 2).
Figure 1
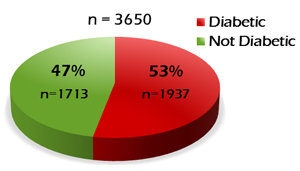 |
Figure 2
 |
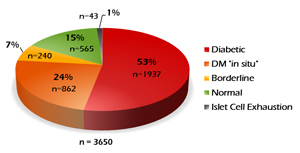
Looking at it another way, we could say that of the original 3650 patients who were administered the OGTT, only 15% (not 53%) were truly normal. Nearly one-third of these patients had an abnormal insulin response that went undetected when looking only at glucose values (Figure 3). If this seems high, we should remember that these were patients referred for OGTT because of a suspicion of DM. Since this original study, Kraft has continued to investigate insulin response as a marker for early detection of developing diabetes. His evaluations of more than 14,000 OGTTs with insulin assays have substantiated his early findings.4
Figure 3
GTIR Insulin Response Patterns
Kraft distinguished five patterns of insulin response. One of these, Pattern III, has two variations. The progression of these patterns depicts the progression of glucose/insulin dysregulation from its earliest stages to full-blown diabetes and insulin dependence. The graphs illustrating these patterns are drawn from actual patient results.
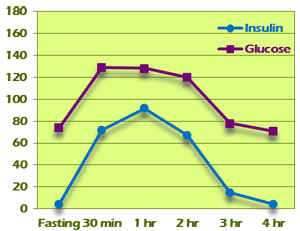
Pattern I
Pattern I represents normal glucose tolerance and insulin response (Figure 4). Fasting insulin is normal at between 0 and 10. Insulin peaks at 30 minutes or 1 hour and is <50 by the second hour. Third-hour insulin is lower than the second hour, and second plus third hour total is <60. Subsequent hour insulin values are back at the fasting range (0–10).
Figure 4
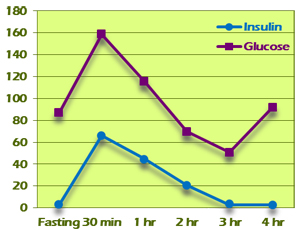 |
Figure 5
 |
Pattern II
Pattern II starts out looking normal but shows evidence of beginning insulin resistance as the test progresses (Figure 5). As in Pattern I, fasting insulin is between 0 and 10 and insulin peaks at 30 minutes or 1 hour. The second hour plus third hour total is more than 60. If the total is between 60 and 100, the test is considered borderline for insulin resistance. If the total is more than 100, the test is considered confirmatory for insulin resistance.
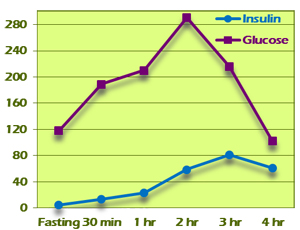
Pattern III
Pattern III shows a delayed insulin peak and a much greater area under the curve. Fasting insulin is between 0 and 10. Pattern III-A insulin peaks at 2 hours. Two-hour glucose levels may be within normal limits, as can be seen in the example in Figure 6. Pattern III-B insulin peaks at 3 hours (Figure 7). Two-hour glucose levels are generally higher although may fall within normal limits. The area under the curve for both insulin and glucose is much greater. Both variants are diagnostic for insulin resistance.
Figure 6
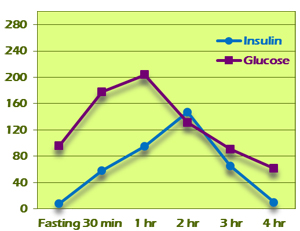 |
Figure 7
 |
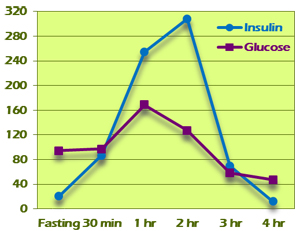
Pattern IV
Pattern IV is characterized by fasting insulin >10 (Figure 8). Elevated fasting insulin is diagnostic for insulin resistance regardless of other values. Glucose values are often in diabetic ranges and insulin levels are dramatically high, typically peaking at the third hour. The area under the curve is quite large. The example in Figure 8 shows a Pattern IV result in which extremely high insulin levels functioned to keep all blood glucose levels within normal levels. This would have been completely missed on a standard OGTT.
Figure 8
 |
|
Page 1, 2
|